Speeding Up eBPF File Opens by 54% (Not AI Gen)
My brother and I designed our eBPF agent to be really fast (using bitmasks, etc.), but we’ve recently doubled down on performance improvements.
For example, I recently implemented an inode cache https://nathannaveen.dev/posts/dropping-ebpf-cpu-cost-by-90/, and my brother implemented longest prefix matching on our policy paths https://neilnaveen.dev/posts/speeding-up-ebpf-filepath-checks/. These changes were pretty large, while the changes I’m covering in this blog post are smaller (following a similar concept to the British Cycling team’s “1% better” philosophy).
But these small changes sped up repeated file opens by 54% and made cold opens about 15% faster.
This blog post is going to read less like a blog post and more like a changelog. I decided to share it because I thought some of these changes were cool and someone might find it interesting.
Our repo is open source, so you can find everything in this blog post at https://github.com/bomfather/agent. And everything discussed in this blog post is between commits 9c521bd and cfc7538.
How did I Find These Issues?
We created a perf test when creating the inode cache, and I’ve been running it after each commit. Then I give the perf results to an LLM and ask it to find inefficiencies I can fix.
I know someone is thinking to themselves that I (the author) wrote “Not AI Gen” in the title, and that I’m a liar. Yeah well… I’m only human, and I don’t want to go through the perf results myself, so I hand it off to my AI. Just because I don’t use AI to write my code doesn’t mean that I am oblivious to what AI is good at.
The Problems
As I mentioned before, these are simple changes I made to get the biggest performance improvements with the smallest amount of change, so none of these are revolutionary ideas.
1. LPM Cache Chunking
I know Longest Prefix Matching (LPM) isn’t the most common thing to know, but I don’t want to explain it in this blog post because that isn’t what this write up is about. If you don’t know what it is, I recommend doing a bit of research about it because it is pretty cool and not too complicated to understand.
Our LPM cache creates 128 byte chunks and assigns an ID to each chunk. Then it stores those IDs and the remaining part of the file path in the LPM trie map.
Previously, a tail shorter than 128 bytes would still go through the lookup. So the kernel would clean the chunk map key, copy the remainder of the bytes to it, and search the map. But the key wouldn’t actually be in the map because it isn’t a full 128 byte chunk.
This change is just an if statement that checks whether the chunk length is less than 128 bytes. If so, we know that we don’t have to do the entire map lookup thingy.
I think this is a pretty cool change because most paths are under 128 bytes, so it removes the map miss on the one and only iteration.
The code: https://github.com/bomfather/agent/commit/2754d343585c6b8acd1184bca28faf73468c21b9.
As I mentioned, I wanted to work on 1% improvements. So, this is an absolutely tiny change, but it has a pretty significant impact.
2. inode Check Before Path Building
This was more of a fix on top of my previous solution rather than a new improvement.
So… Um… In my previous blog post https://nathannaveen.dev/posts/dropping-ebpf-cpu-cost-by-90/, I said that we checked whether the inode cache key was in the cache, and only if it wasn’t did we build the path. Yeah… Well, it turns out lsm_file_open always rebuilt the path first. I meant to check the cache before building the file path, but I guess I forgot to write the code to do so (I’m nervously laughing while writing this).
Well, my solution to this problem is to just implement the fix and sweep this debacle under the rug :) So, that is exactly what I did: https://github.com/bomfather/agent/commit/d50233e1bc4a0790b8ee08dcc9196ce7d0b82328.
On the upside, we saw great performance improvements even when building the file path before checking the cache, and even better performance after implementing this change. All is well that ends well.
3. Stop Attaching ptrace Only Programs Unless block_ptrace Is On
So, our agent can block ptraces because you usually don’t need ptrace on a server (you don’t need to enable ptrace blocking if you are actually using ptrace).
This is great, but most processes read /proc/<pid>/stat. And /proc/<pid>/stat calls ptrace_may_access inside the kernel, so our ptrace hook sees it as a trace read. So when blocking ptrace, the agent would block access to /proc/<pid>/stat.
To deal with this, we have lsm_inode_permission check the inode, and when the inode is a procfs file named stat, we store a single use token on the task with the pid. Then, on the following ptrace_access_check, we allow the operation if the gate is set, the pid matches, and the mode is read. Then we clear the token for the next access to /proc/<pid>/stat.
But if a process opens /proc/<pid>/stat and doesn’t reach the ptrace check, the gate remains set, and the next ptrace can run even if it should be blocked. To fix this, we have tp_exit_openat and tp_exit_openat2 clear the token when the ptrace hook doesn’t consume it.
I sped this up by loading only the programs lsm_inode_permission, tp_exit_openat, and tp_exit_openat2 when ptrace blocking is enabled. We can do this because these functions are only used when someone is trying to access /proc/<pid>/stat while ptrace blocking is enabled.
The code: https://github.com/bomfather/agent/commit/20ecdab9b54dc8f40182dd8b27f192078e1f973f
Performance Changes
I ran the benchmark we previously used for the inode cache at commit 9c521bd and again at cfc7538.
The benchmark opens one file 200,000 times to simulate repeated opens, then opens 20,000 brand new files so all these new opens miss the inode cache. We then repeat this 5 times to ensure we don’t have a lot of spread between runs.
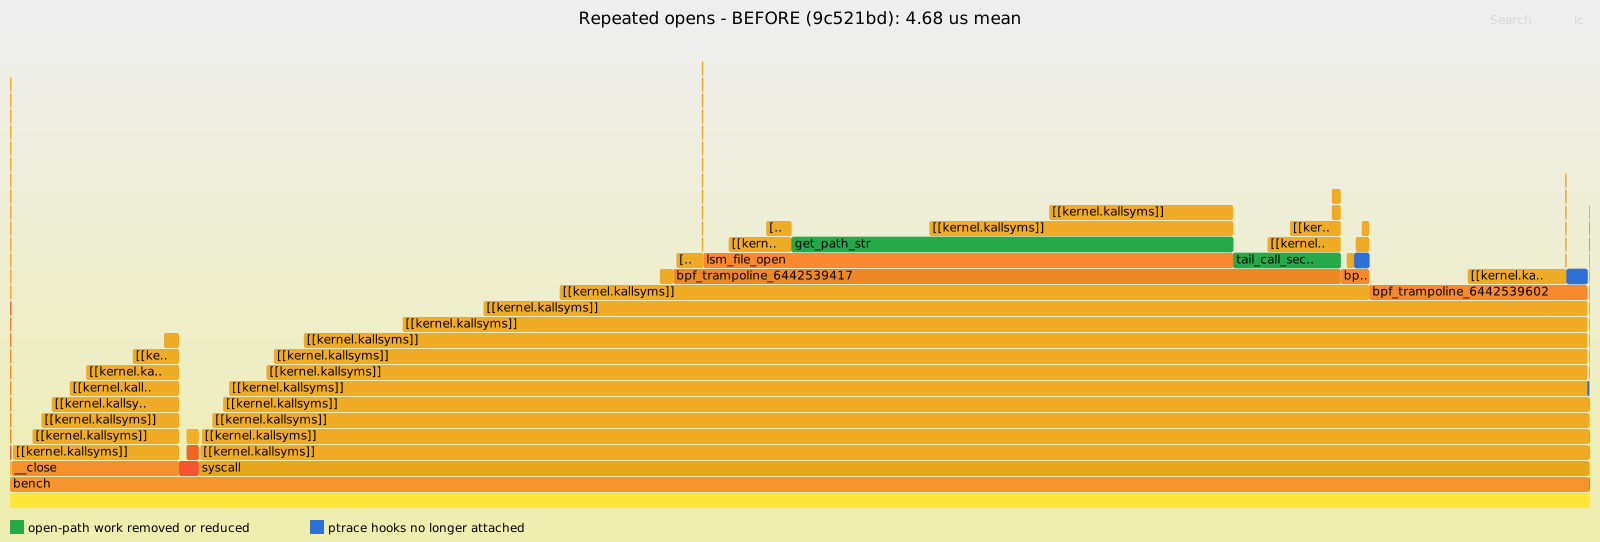
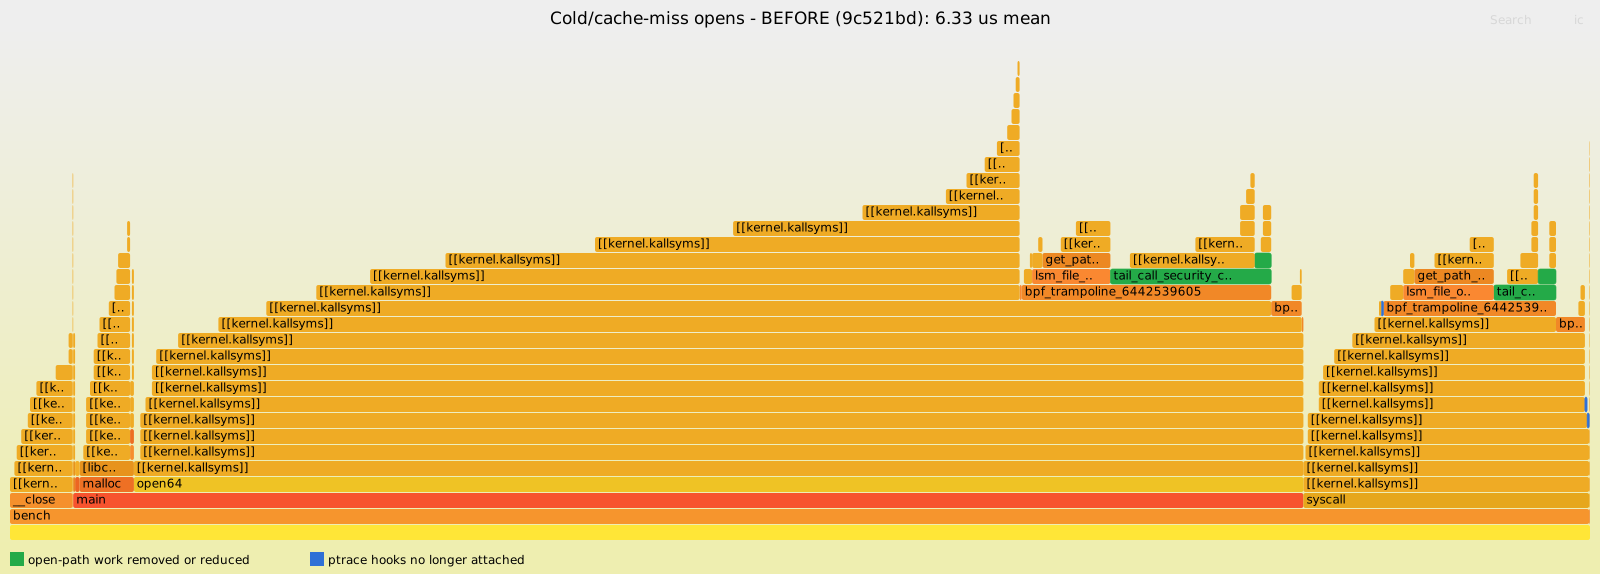
So, with these changes, a repeated open dropped from 4.68 µs to 2.15 µs, which is about 54% lower. And on cold opens, we dropped from 6.33 µs to 5.36 µs, about 15% lower. The repeated open p99 fell from 8.3 µs to 3.46 µs, which is a pretty nice improvement. But these changes didn’t really do much for the cold opens p99.
Repeated Opens Performance Changes
Before (9c521bd):
After (cfc7538):
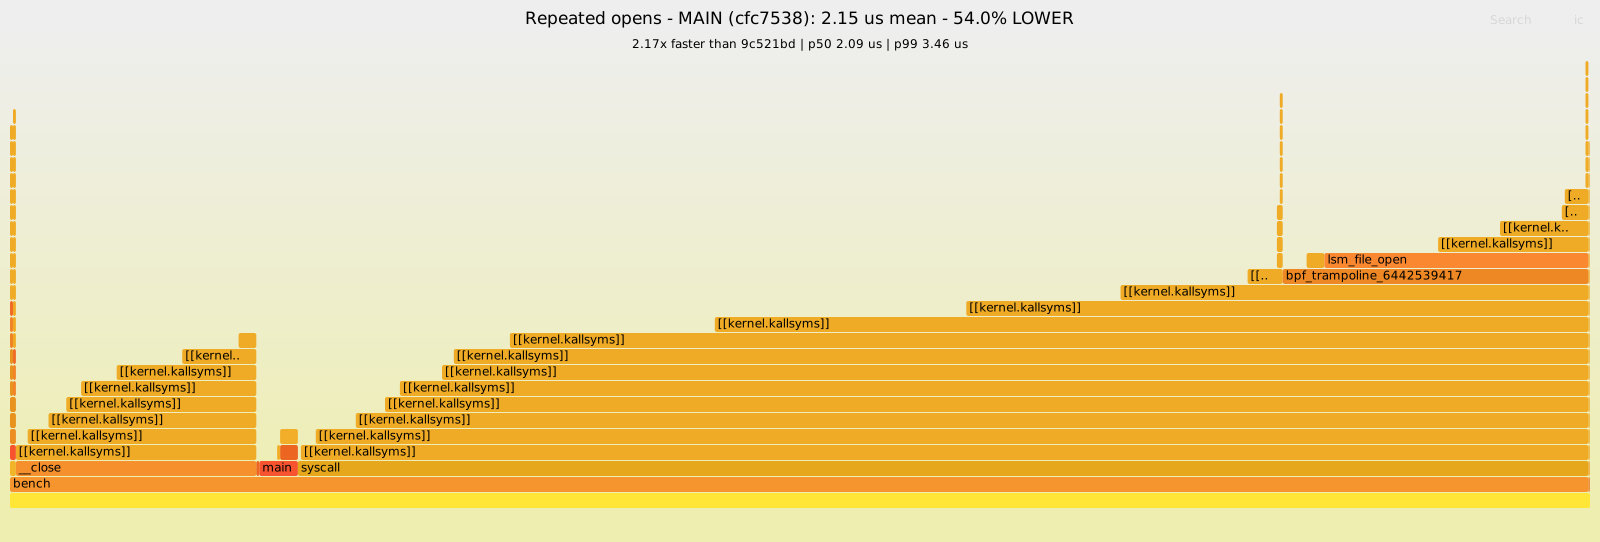
We can see where the 54% went on repeated opens. Both green bars in the first flame graph sit under lsm_file_open and result from our second change (checking the inode before building the path).
get_path_str is the wide green bar, and it ran every time lsm_file_open called get_filename to rebuild the path string. The shorter green bar is tail_call_security_check. After we created a path, lsm_file_open would tail call into this program and run the trusted executable check and the cache lookup.
There are also three blue bars, two are relatively easy to see, but the third is very small and at the far right of the graph (you might need to squint to see it). The first two are the function lsm_inode_permission. They are both the same function, but there are two bars because they are called on two different stacks. On every open, lsm_inode_permission checks whether the inode is a procfs file named stat. And since the test only opens normal files, lsm_inode_permission ignores it and returns 0.
The third blue bar is tp_exit_openat, and it is only about 0.09% wide, so we can barely see it on the graph. It’s the cleanup function that runs when openat returns to userspace. tp_exit_openat2 does the same thing, but the test we ran only uses openat, so it doesn’t show up on this graph.
Cold Open Performance Changes
Before (9c521bd):
After (cfc7538):
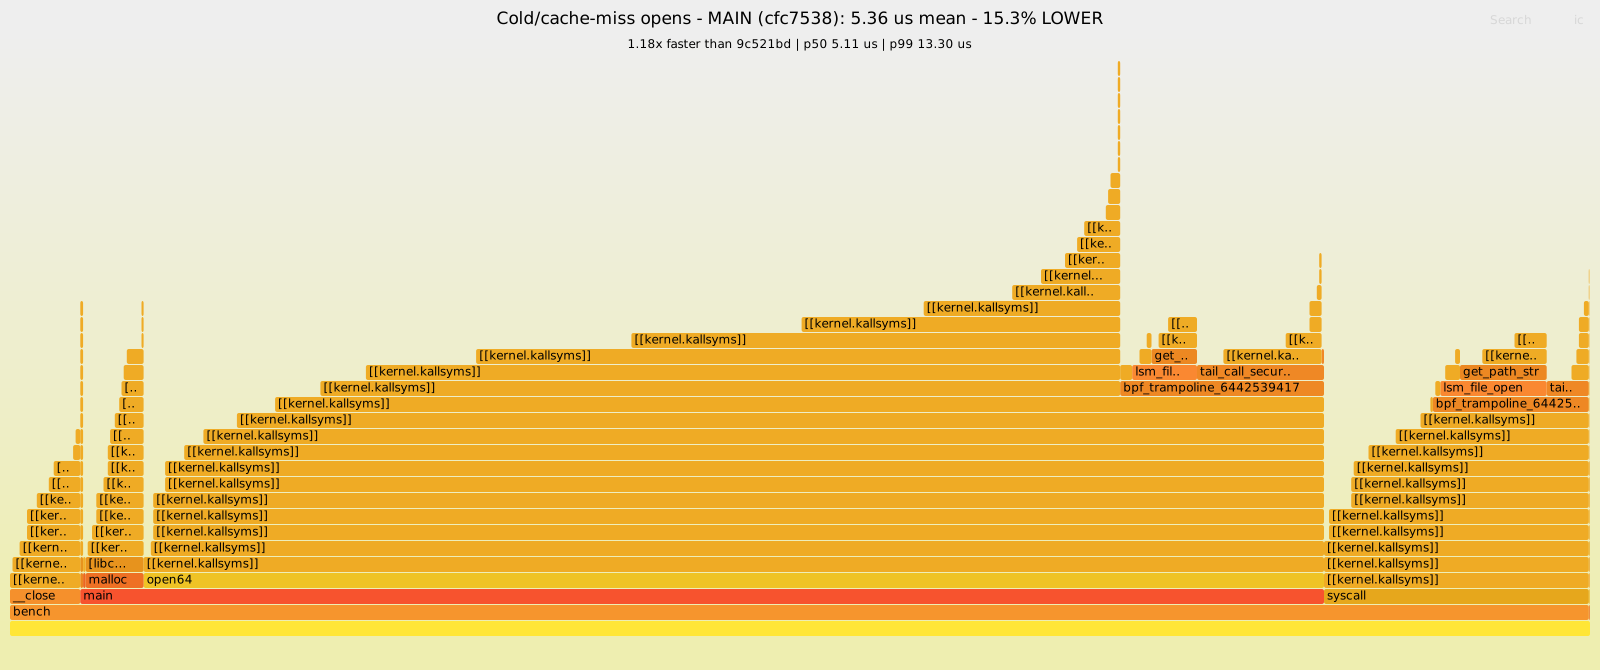
On a cold open, we build the path using the LPM trie because we don’t hit the inode cache.
The paths we use in the benchmark test are shorter than 128 bytes, so the first piece is the entire path. So, when we implemented the first code change (the if statement to check whether the path length is under 128 bytes), we saw a decent performance improvement.
Before the LPM trie check, a path smaller than 128 bytes would have to clear the chunk map key, copy the bytes into it, and then look up that key. Then, when the lookup missed, it would have to do the trie search. With this new change, we don’t have to do that whole process.
This is affecting the get_access_index_for_filepath bar in the flame graph. You can’t really see the bar’s name because it is too small, but it is the narrow green one without a label. This change reduces get_access_index_for_filepath from 2.2% to 0.2%. And tail_call_security_check drops from 14.1% to 10.7% because get_access_index_for_filepath is stacked on top of tail_call_security_check.
And the blue bars are part of the third change (not attaching some functions unless we are blocking ptrace). They are just lsm_inode_permission and tp_exit_openat.
Outro
This was a decently long write up, but I thought it was pretty fun to see how relatively small changes could have big impacts on performance. Anyway, I hope you enjoyed the blog post, thanks for reading!